Valen0604
Food-Shelf Need vs. Recorded Demand in Minnesota (MinneMUDAC 2026)
Graduate-division entry to MinneMUDAC 2026, the Minnesota data analytics competition run by MinneAnalytics. The sponsor, The Food Group, provided 55 months (January 2022 to July 2026) of monthly reports from every food shelf in its Minnesota network and asked six questions about need, demand, prices, SNAP, forecasting and food access.
Team Data Detectors, three students. This folder holds my part of the work: the shared data pipeline, Question 1 (does recorded activity track need?) and Question 6 (a falsifiable measure of need and where it diverges from recorded activity). The team’s full repository is private because it contains the sponsor’s data. Submitted 17 October 2026.
The question in one sentence
Food shelves report how many households they serve. Feeding America estimates how many people are food insecure. Across Minnesota’s 87 counties, do those two agree, and where they do not, why?
What I found
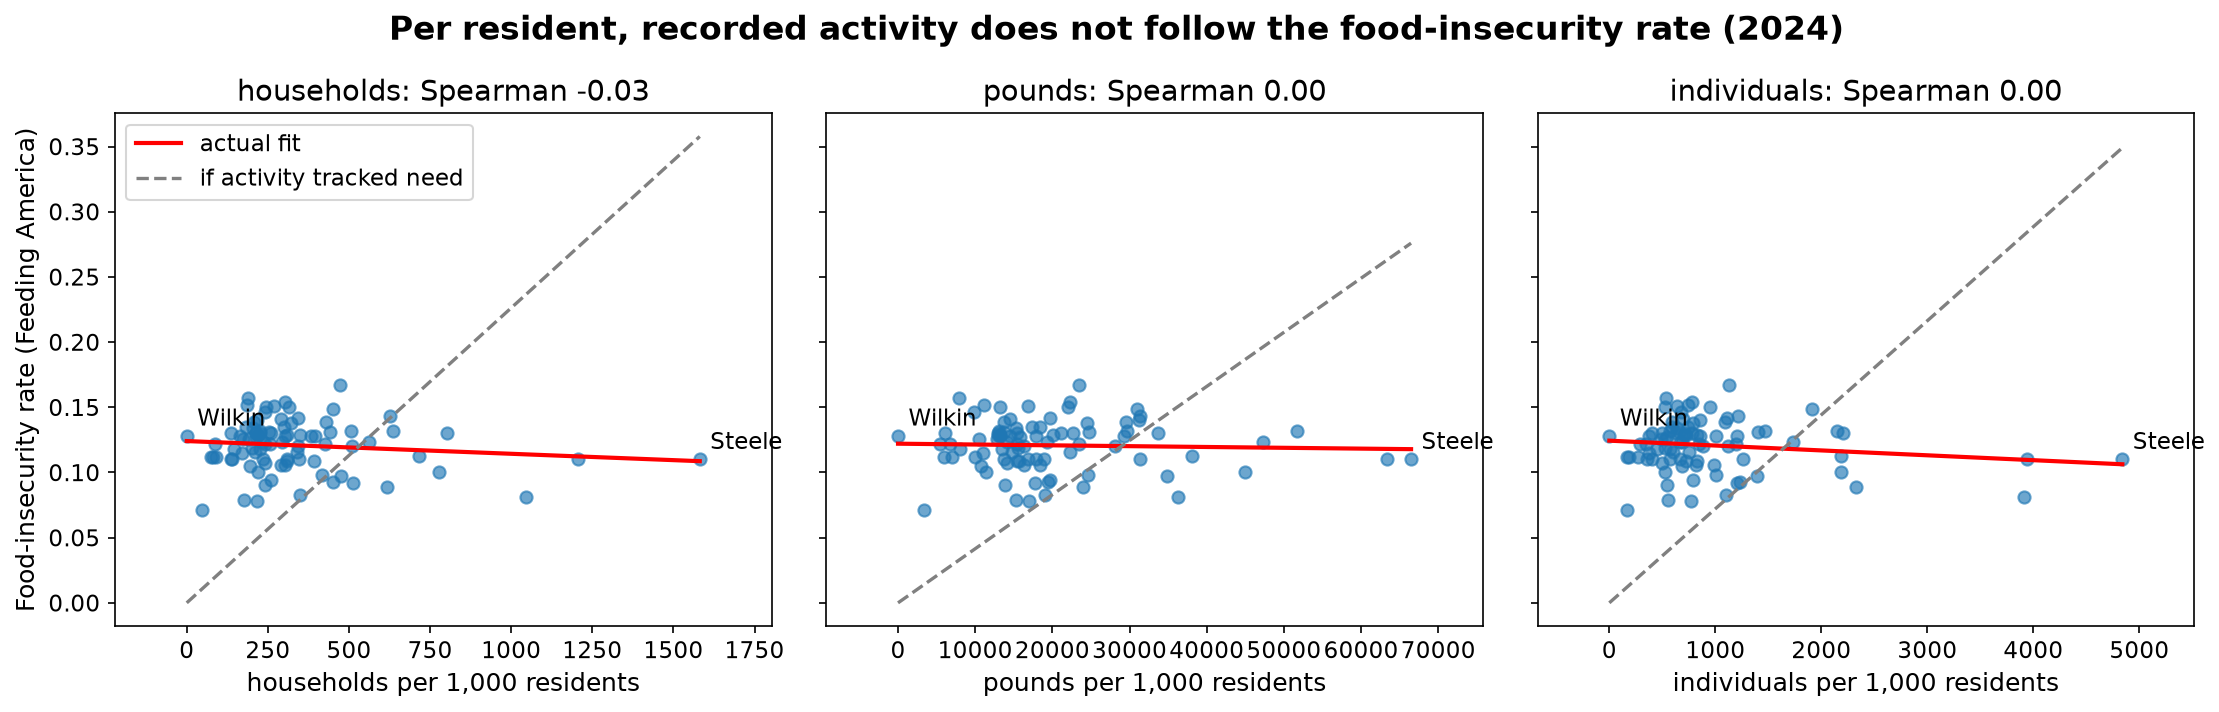
Counts agree with need; rates do not (Q1). A county with ten times the food-insecure people records about sixteen times the activity: log-log slope 1.15 to 1.24 across three metrics and three years, every confidence interval above 1, R² 0.84 to 0.88. Per 1,000 residents, however, recorded activity is uncorrelated with the food-insecurity rate (Spearman −0.03 to 0.17). Pounds distributed tracks need best and households served worst, by a small, consistent margin. Four county characteristics the brief names (distance to a site, rurality, no-vehicle households, SNAP households) explain 3% of the mismatch. Three spatial tests (Moran’s I, join counts, a pooling test) find no border pattern among the mismatched counties.
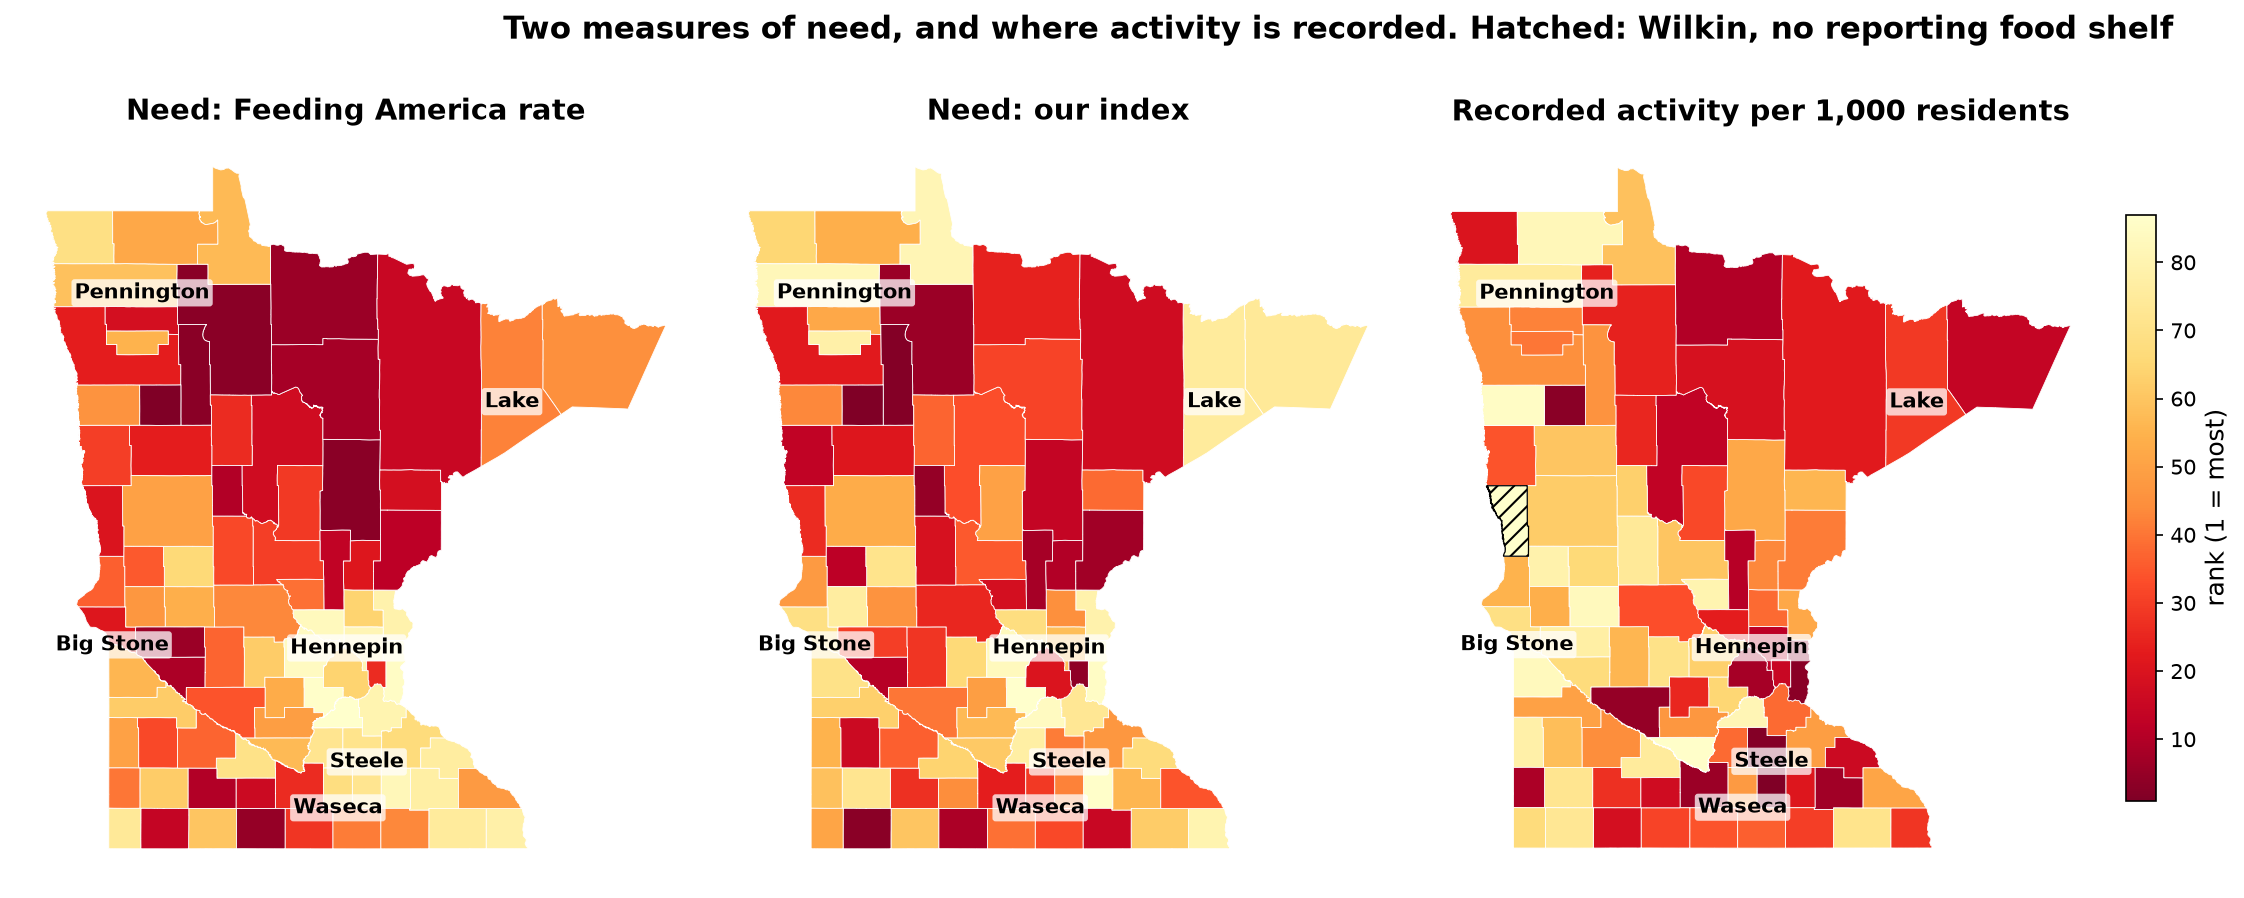
A falsifiable measure of need (Q6). Before touching the data I wrote down a definition that a survey could prove wrong: a household is in need if, at any point in the past year, it worried about running out of food, regardless of whether it sought help (the first item of the USDA food-security questionnaire). The county measure is an equal-weight index of seven public inputs, each chosen because it is measurable at zero demand and is not an input to Feeding America’s model: SNAP households, no-vehicle households, senior poverty, housing-cost burden, adults without a diploma, low-income low-access share, and debt in collections. As a test, I predicted one county’s rank before the index existed (Wilkin, about the 70th percentile); it landed at the 71st. The top seven counties on need hold under every alternative weighting tried.
Where need and activity diverge, and why. The index agrees broadly with Feeding America (Spearman 0.77) but differs on five of the top ten, and neither predicts recorded activity per resident. Head to head, county population alone explains 85% of recorded activity and neither measure of need adds more than a point of R². Two barriers explain the divergence: households without home internet (+0.41 SD, p = 0.005) and distance to the nearest site (+0.23 SD, p = 0.025), 17% of the variance. The through-line of the team’s deck: recorded activity follows population and sites; need, measured either way, barely moves it.
Methods
- Pipeline (
src/): cleaning of the sponsor’s site-level file into site-month and county-month panels, a food-shelf-type flag per site, a county covariate table built from Census ACS 5-year tables (B22003, B08201, B17001, B25070/B25091, B15003, B16002, B28002, B05001), the USDA Food Access Research Atlas, USDA rural-urban codes, the Census county adjacency file and the Urban Institute’s Debt in America. Every public source is registered with publisher, exact series, grain and reason indocs/DATA_SOURCES.md. - Q1: log-log OLS of activity on food-insecure persons per county-year; residual ranking; covariate model with errors clustered by county; Moran’s I with permutation p, join counts and a pooling test against random county groupings.
- Q6: pre-registered definition and rejection criteria (
questions/q6_divergence_measure/addendum.md); within-year z-scores, equal weights; divergence as need rank minus activity rank; stability under alternative weightings and random (Dirichlet) weights; barrier regression with clustered errors; nested models against Feeding America’s rate. - Discipline: a prediction written before every result; the organizers’ leakage rule (nothing dated August 2026 enters the repository) enforced at download time.
What is here and what is not
| here | not here |
|---|---|
questions/q1_need_vs_activity/: README with the answers, analysis.py that rebuilds every number |
the sponsor’s site-level data and anything derived from it at county level (data/, residual rankings, per-county activity) |
questions/q6_divergence_measure/: README, analysis.py, the graduate addendum written before the index existed |
the team’s Q4, Q5, Q7 and Q8 work (teammates) |
src/: the pipeline modules I wrote |
the August 2026 forecast submission |
docs/: glossary and the public data-source registry |
|
figures/, tables/: model summaries (fits, correlations, covariate and barrier models, stability, index vs. Feeding America) and the need index built from public inputs |
|
notebooks/q6_exploration.ipynb: the Q6 working notebook, outputs cleared |
|
deck_MinneMUDAC_2026_Data_Detectors.pdf: the team’s presentation |
The scripts will not run from this folder: they expect the sponsor’s data under data/.
They are here to show how the numbers were produced.
Tools
Python (pandas, statsmodels, geopandas, matplotlib), Census API, Git.